 Midas
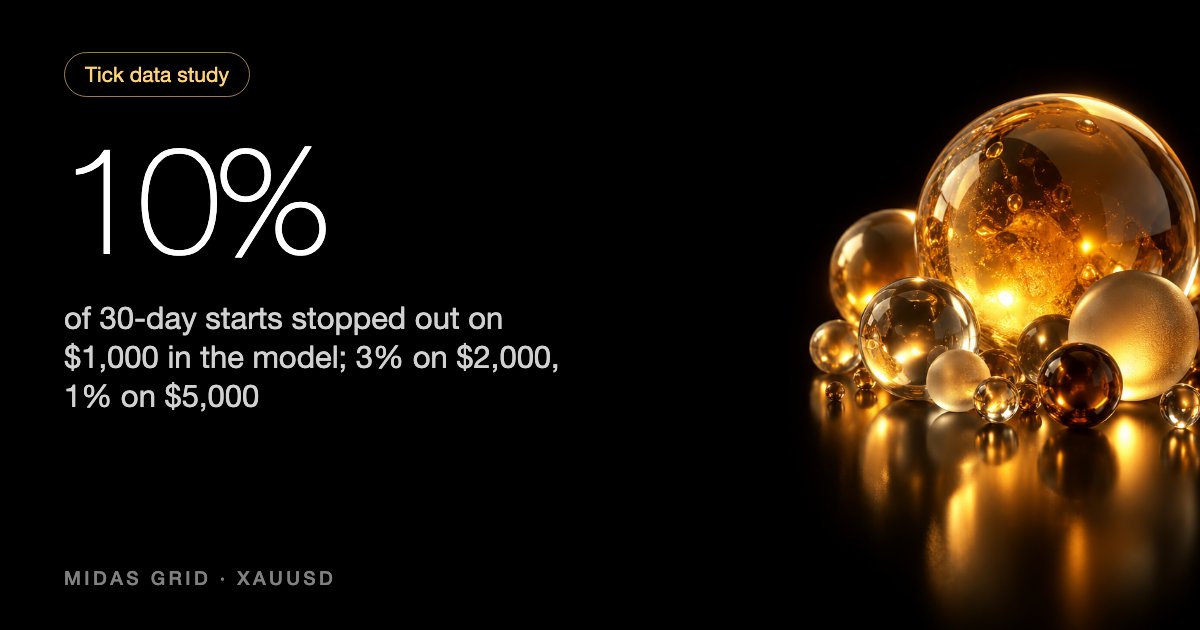
In short: In the model, on gold ticks since January 2025, a grid with a $2 step, lot doubling and a cap of 9 orders on a 0.01 lot was stopped out in 10% of 30-day starts with a $1,000 deposit, in 3% with $2,000 and in 1% with $5,000. 8.8% of baskets reached the 5th order and 1.3% the 9th. Extra orders are expensive: the deposit that was enough in 90% of starts grew from $997 at 9 orders to $1,905 at 10, $2,891 at 11 and $5,627 at 12.
The result is for a grid with no protections: one basket at a time, no stop-loss and no limit on how long a basket may be held. It is a generic martingale-grid model, not the settings of any one expert advisor.
On this page (11)
What exactly was measured?
- Grid: gold XAUUSD, first order 0.01 lot, each next order M times larger than the last (M = 2 is doubling), a grid step of S dollars in price, a cap of N orders (a order is one order of the grid).
- Exit: the basket closes when price returns $1.5 above the break-even price. Other values are tested in the sensitivity section.
- Account: a cent account, leverage 1:2000, spread $0.40, broker stop-out at a 40% margin level. A "stop-out" is what we count as a loss of the deposit.
- Data: Dukascopy ticks for XAUUSD from 2 January 2025 to 23 October 2026, 467 trading days, about 143.7 million ticks. See Methodology and data.
- Starts: an account starts every third trading day, 187 starts in all. From each start the grid trades with no top-ups, and we compute the deposit it needed to live to the end of a 30-day or 90-day window. A deposit "survives" a start if it is at least that needed amount.
Why starts instead of one long run. In the first continuous run the number of stop-outs for close settings came out in the wrong order: a deeper grid sometimes had fewer stop-outs than a shallower one. It depended on which basket happened to be open during the sharp fall in gold in January 2026, not on the settings. A set of starts removes that luck. There are 179 starts with 30 days of data after them; they overlap, so the independent observations number about the months in the sample (around 21).
How many orders does a grid actually reach?
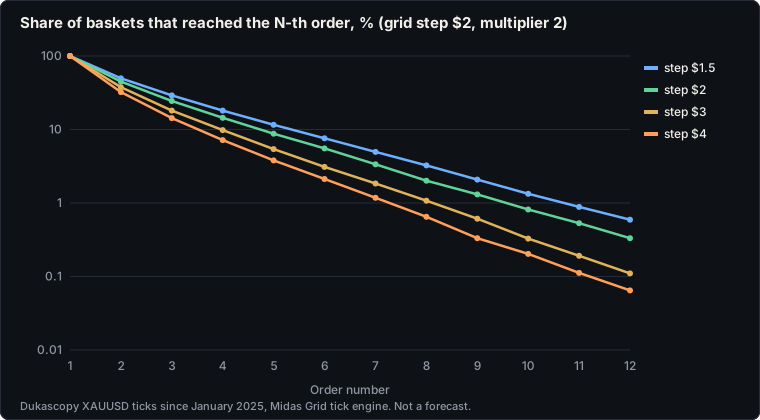
Most baskets close on the first orders. The share of baskets that reached the N-th order, at a $2 step and doubling:
| Step | 2 | 3 | 4 | 5 | 6 | 7 | 8 | 9 | 10 | 11 | 12 |
|---|---|---|---|---|---|---|---|---|---|---|---|
| $1.5 | 49.69% | 29.13% | 18.09% | 11.59% | 7.59% | 4.96% | 3.25% | 2.08% | 1.33% | 0.89% | 0.59% |
| $2 | 44.85% | 24.41% | 14.41% | 8.78% | 5.53% | 3.36% | 2.01% | 1.31% | 0.82% | 0.53% | 0.33% |
| $3 | 37.66% | 18.09% | 9.8% | 5.41% | 3.1% | 1.84% | 1.08% | 0.61% | 0.33% | 0.19% | 0.11% |
| $4 | 32.31% | 14.28% | 7.18% | 3.8% | 2.12% | 1.18% | 0.65% | 0.33% | 0.20% | 0.11% | 0.06% |
In the model, on Dukascopy ticks since January 2025. Counted over the baskets of a run with a cap of 12 orders; each column is the share of baskets that reached at least that order.
At a $2 step 45% of baskets reach the 2nd order, 8.8% the 5th, 1.3% the 9th and 0.3% the 12th. Each order cuts the share by a factor of 1.5 to 2 while the lot doubles, so the risk hardly shrinks with depth: the rare deep baskets carry most of the danger. A wider step makes depth rarer: at a $4 step 0.33% reach the 9th order, at $1.5 it is 2.1%.
What deposit does a grid survive?
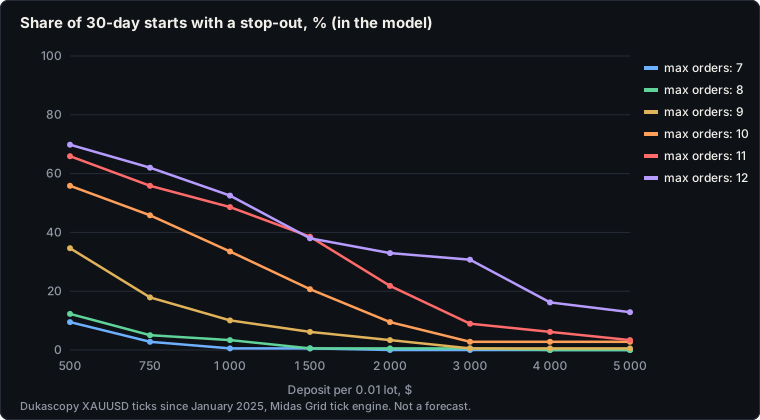
The main table: the share of 30-day starts in which an account on a 0.01 lot was stopped out, at a $2 step, doubling and a $1.5 take profit.
| Max orders | $500 | $750 | $1,000 | $1,500 | $2,000 | $3,000 | $5,000 |
|---|---|---|---|---|---|---|---|
| 7 | 9% | 3% | 1% | 1% | 0% | 0% | 0% |
| 8 | 12% | 5% | 3% | 1% | 1% | 1% | 0% |
| 9 | 35% | 18% | 10% | 6% | 3% | 1% | 1% |
| 10 | 56% | 46% | 34% | 21% | 9% | 3% | 3% |
| 11 | 66% | 56% | 49% | 39% | 22% | 9% | 3% |
| 12 | 70% | 62% | 53% | 38% | 33% | 31% | 13% |
In the model, on Dukascopy ticks since January 2025; 179 starts. $2 step, multiplier 2, take profit $1.5 above break-even.
How to read it. At 9 orders a $1,000 account was stopped out in 10% of monthly starts, $2,000 in 3%, $500 in 35%. At 12 orders the same $2,000 was stopped out in 33%.
If you started every month afresh with a new deposit, this is roughly how many stop-outs a year you would see (the share times 12.17):
| Max orders | $500 | $750 | $1,000 | $1,500 | $2,000 | $3,000 | $5,000 |
|---|---|---|---|---|---|---|---|
| 7 | 1.2 | 0.3 | 0.1 | 0.1 | 0.0 | 0.0 | 0.0 |
| 8 | 1.5 | 0.6 | 0.4 | 0.1 | 0.1 | 0.1 | 0.0 |
| 9 | 4.2 | 2.2 | 1.2 | 0.7 | 0.4 | 0.1 | 0.1 |
| 10 | 6.8 | 5.6 | 4.1 | 2.5 | 1.2 | 0.3 | 0.3 |
| 11 | 8.0 | 6.8 | 5.9 | 4.7 | 2.7 | 1.1 | 0.4 |
| 12 | 8.5 | 7.5 | 6.4 | 4.6 | 4.0 | 3.7 | 1.6 |
In the model, on Dukascopy ticks since January 2025. This converts the share of monthly starts into "stop-outs a year with a fresh deposit every month"; it is not the number of stop-outs of one account in a row.
At 9 orders and $1,000 that is about 1.2 stop-outs a year, at $2,000 about 0.4.
What about 90 days?
The longer the window, the more often a basket gets stuck in a trend and the more is needed.
| Max orders | $500 | $750 | $1,000 | $1,500 | $2,000 | $3,000 | $5,000 |
|---|---|---|---|---|---|---|---|
| 7 | 26% | 11% | 9% | 9% | 0% | 0% | 0% |
| 8 | 24% | 18% | 16% | 9% | 9% | 9% | 0% |
| 9 | 43% | 30% | 24% | 17% | 13% | 6% | 6% |
| 10 | 66% | 54% | 40% | 30% | 20% | 16% | 9% |
| 11 | 80% | 74% | 69% | 56% | 35% | 17% | 11% |
| 12 | 84% | 81% | 78% | 68% | 63% | 54% | 23% |
In the model, on Dukascopy ticks since January 2025; 161 starts with 90 days of data after them.
Held for a year with no top-ups and no intervention the picture is worse. In 84 one-year starts a $5,000 account at 9 orders was stopped out in 89% of cases: the year in this sample includes gold rising from $2,614 to $5,597 and a sharp fall in January 2026. This is a lower bound. The one-year sample is short and the windows overlap heavily, so we do not build a table from it.
What does the order cap buy?
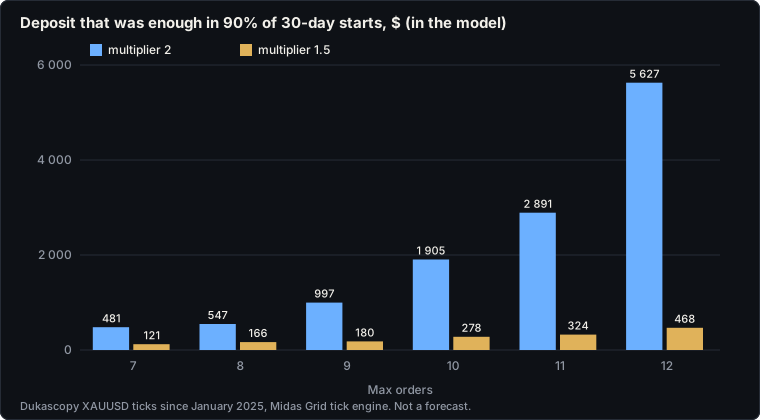
Each added order doubles the lot, and price has to travel one more step before it fills. In the model the deposit you need grows faster than linearly with the cap:
| Max orders | Enough in half of starts (30 d) | Enough in 90% of starts (30 d) | Enough in 90% of starts (90 d) | Worst start (30 d) | Lots in a full basket |
|---|---|---|---|---|---|
| 7 | $113 | $481 | $766 | $1,655 | 1.27 |
| 8 | $149 | $547 | $1,300 | $3,178 | 2.55 |
| 9 | $354 | $997 | $2,401 | $6,318 | 5.11 |
| 10 | $668 | $1,905 | $4,649 | $12,614 | 10.23 |
| 11 | $963 | $2,891 | $5,279 | $10,741 | 20.47 |
| 12 | $1,076 | $5,627 | $8,344 | $21,418 | 40.95 |
In the model, on Dukascopy ticks since January 2025. "Worst start" is one start out of 179: an order of magnitude, not a promise. At 11 orders it is lower than at 10 because the tail is set by single events.
From 9 to 10 orders the needed deposit roughly doubles, and from 10 to 11 and from 11 to 12 it grows by another 1.5 to 2 times. Nine is not a magic number: with a cap of 7 to 9 the needed deposit in this sample is about a thousand dollars or less, and beyond that it roughly doubles per order. Income was not measured in this study, so nothing here says a deeper grid is or is not worth it.
How do step and multiplier change the picture?
Grid step. A wider step stretches the grid and cuts the share of deep baskets. Cap of 10 orders, multiplier 2:
| Grid step | Span of orders 1-10 | Stop-out at $1,000 | Stop-out at $2,000 | Enough in 90% of starts |
|---|---|---|---|---|
| $1.5 | $13.5 | 41% | 15% | $2,297 |
| $2 | $18 | 34% | 9% | $1,905 |
| $3 | $27 | 16% | 7% | $1,656 |
| $4 | $36 | 12% | 7% | $1,449 |
In the model, on Dukascopy ticks since January 2025.
Lot multiplier. A multiplier of 1.5 instead of 2 lowers the needed deposit sharply, not because it is "smarter" but because lots grow more slowly: a full 9-order basket at 1.5 carries 0.75 lots against 5.11, so what it earns or loses per dollar of movement is almost 7 times smaller. Lots are rounded to the 0.01 step.
| Max orders | Multiplier | Lots in a full basket | Stop-out at $1,000 | Stop-out at $2,000 | Enough in 90% of starts |
|---|---|---|---|---|---|
| 9 | 2 | 5.11 | 10% | 3% | $997 |
| 9 | 1.5 | 0.75 | 0% | 0% | $180 |
| 10 | 2 | 10.23 | 34% | 9% | $1,905 |
| 10 | 1.5 | 1.13 | 1% | 0% | $278 |
| 11 | 2 | 20.47 | 49% | 22% | $2,891 |
| 11 | 1.5 | 1.71 | 1% | 0% | $324 |
| 12 | 2 | 40.95 | 53% | 33% | $5,627 |
| 12 | 1.5 | 2.57 | 4% | 0% | $468 |
In the model, on Dukascopy ticks since January 2025. $2 step, take profit $1.5.
Worst starts and worst days
For 9 orders, a $2 step and doubling, 18 of 179 starts (about 10%) needed more than $1,000. The heaviest starts:
| Start (30-day window) | Deposit a 9-order grid needed |
|---|---|
| 2025-12-31 | $6,318 |
| 2026-08-05 | $2,693 |
| 2025-10-21 | $2,143 |
| 2026-06-16 | $1,948 |
In the model, on Dukascopy ticks since January 2025. Windows overlap: neighboring dates are the same event.
The widest days of the whole period by price (the difference between the day's highest and lowest bid):
| Day (UTC) | Price range in the day |
|---|---|
| 2026-01-30 | $771 |
| 2026-01-29 | $497 |
| 2026-02-02 | $483 |
| 2026-01-28 | $440 |
| 2026-03-03 | $384 |
Dukascopy tick history, XAUUSD; day in UTC.
How sensitive is the result to the take profit?
A little, but visibly. The farther the take profit, the longer a basket hangs in a trend:
| Max orders | Take profit above break-even | Stop-out at $1,000 | Stop-out at $2,000 | Enough in 90% of starts |
|---|---|---|---|---|
| 9 | $1 | 13% | 3% | $1,244 |
| 9 | $1.5 | 10% | 3% | $997 |
| 9 | $3 | 17% | 7% | $1,446 |
| 10 | $1 | 28% | 9% | $1,754 |
| 10 | $1.5 | 34% | 9% | $1,905 |
| 10 | $3 | 31% | 11% | $2,062 |
| 11 | $1 | 46% | 25% | $2,761 |
| 11 | $1.5 | 49% | 22% | $2,891 |
| 11 | $3 | 55% | 26% | $4,185 |
In the model, on Dukascopy ticks since January 2025. $2 step, multiplier 2.
The order of deposits and the gap between 9, 10 and 11 orders hold at take profits of $1, $1.5 and $3.
Methodology
The engine reads ticks in order, adds a order when price passes the step, applies a 30-second pause between orders and a 0.3-second delay, a $0.40 spread and commission. It was checked: over two weeks (7 to 21 March 2025) 135 of 136 baskets matched our reference engine to the cent; the one extra basket sits on the period boundary. The full description, the data source and the model's errors are on the Methodology and data page.
Limits of the model
- Constant $0.40 spread. It is wider at news and at the rollover; a stop-out would come earlier.
- No slippage beyond a fixed 0.3-second delay, no rejected orders, no swaps.
- Dukascopy quotes, not your broker's. Your stop-out can come a few cents earlier or later.
- Simplified margin: one 1:2000 leverage and a 40% stop-out for the whole account.
- One window. Under two years, one very strong trend and a sharp reversal. Another period gives other numbers; two or three stop-outs are not statistics.
- Overlapping starts. 179 windows of 30 days are about 21 independent months. Read a few percentage points between neighboring cells of a table as noise.
- The past does not promise the future. This is arithmetic of past ticks, not a forecast and not investment advice. Trading with leverage carries risk: if the deposit is too small, a stop-out is possible. Size your deposit with a safety margin.
Check your own numbers
- Gold grid calculator: lots, margin and the stop-out price for your settings.
- Margin calculator and cent account calculator.
- The Midas Grid emulator replays your grid settings day by day through the same gold ticks since January 2025.
- Video: 4 live gold grid strategies (6 min, in English) shows the cushion per 0.01 on live accounts: about $1,000 per 0.01 made +$1,385 in a month, $250 per 0.01 was stopped out on August 19.
See also: how much deposit a grid bot needs, martingale blow-up probability, margin call vs stop-out, is grid trading safe.
See also: how a gold grid EA works and the gold trading bot guide.
Frequently asked questions
How much deposit does a gold grid need on a 0.01 lot?
It depends on the order cap. In the model, with a $2 step, lot doubling and a take profit $1.5 above break-even, $1,000 survived 90% of 30-day starts at 9 orders, but only 66% at 10 and 47% at 12. To get through 90% of 30-day starts you needed $997 at 9 orders and $5,627 at 12. This is in the model, on Dukascopy ticks since January 2025, not a forecast.
How many orders does a gold grid actually reach?
In the model, at a $2 step with doubling, 45% of baskets reached the 2nd order, 24% the 3rd, 8.8% the 5th, 1.3% the 9th and 0.3% the 12th. Baskets beyond the 9th order are rare, but they set the deposit you need.
Is a 9-order grid better than a 12-order grid?
In the model, more orders means a heavier loss tail: the deposit that was enough in 90% of starts rises from $997 at 9 orders to $5,627 at 12, and the share of starts with a stop-out at $2,000 from 3% to 33%. Income was not measured here, so "better" in money terms cannot be said; for stop-out risk, 9 is better.
Can a gold grid avoid losing the deposit altogether?
In the model there would be no stop-outs only with a deposit above the worst start: for 9 orders on 0.01 lot that is $6,318, one start out of 179, not a guarantee. Held for a full year with no top-ups and no intervention (84 one-year starts), a $5,000 account at 9 orders was stopped out in 89% of cases, because that year contains a rally and a sharp fall in gold.
This is arithmetic of past ticks, not a forecast. Trading with leverage carries risk: if the deposit is too small, a stop-out is possible. Size your deposit with a safety margin. Nothing here is individual investment advice.