 Midas
An ATR grid step widens the distance between orders after gold has been moving more, and the size of moves does come in clusters, but no volatility, trend or impulse reading we tested on gold ticks told which way the next move would go — so an ATR step changes how deep the basket reaches, not whether price turns back before the stop-out.
Arithmetic of settings and results of our model on past ticks, not a forecast and not advice. Trading with leverage carries risk: if the deposit is too small, a stop-out is possible.
On this page (8)
What is an ATR grid step?
ATR (average true range) is the average size of a candle over the last N candles, including gaps between them. On M15 with N = 14 it is roughly "how far gold has moved in a typical quarter-hour lately".
An ATR grid step sets the distance between grid orders as a multiple of ATR, for example step = 1.5 × ATR(14, M15), usually with a minimum and a maximum. When gold is calm the orders sit closer; when it is busy they sit further apart. A fixed step is the same number of dollars all the time, such as $1.95.
What can be predicted: the size of moves
Volatility clusters. A busy hour tends to be followed by a busy hour, and calm by calm. On our gold ticks:
- the realised volatility of the last 60 minutes correlated with the size of the next 15-minute move at r ≈ 0.52;
- an hour with a scheduled US or ECB release moved about 2.4 times more than other hours ($29.55 against $12.53 median range of the hour);
- after NFP the first ±$20 came in a median 4.7 minutes.
Published regime-switching studies of currency markets find the same picture: turbulent stretches last a few hours on average and calm ones longer. So an ATR step is not guessing blindly: it does widen when wider moves are more likely.
What cannot be predicted: the direction
The direction of the next move is what decides a grid basket, and that is where every signal failed. We tested 2,106 stretches of 2025–2026 where gold ran $13.4 or more in one direction (enough to fill 9 orders), at 11,828 decision points, against trend (moving averages 50/200 on M1 to H1), impulse over 5 to 240 minutes, breakouts, candle colour on H1 to D1 and the trading session.
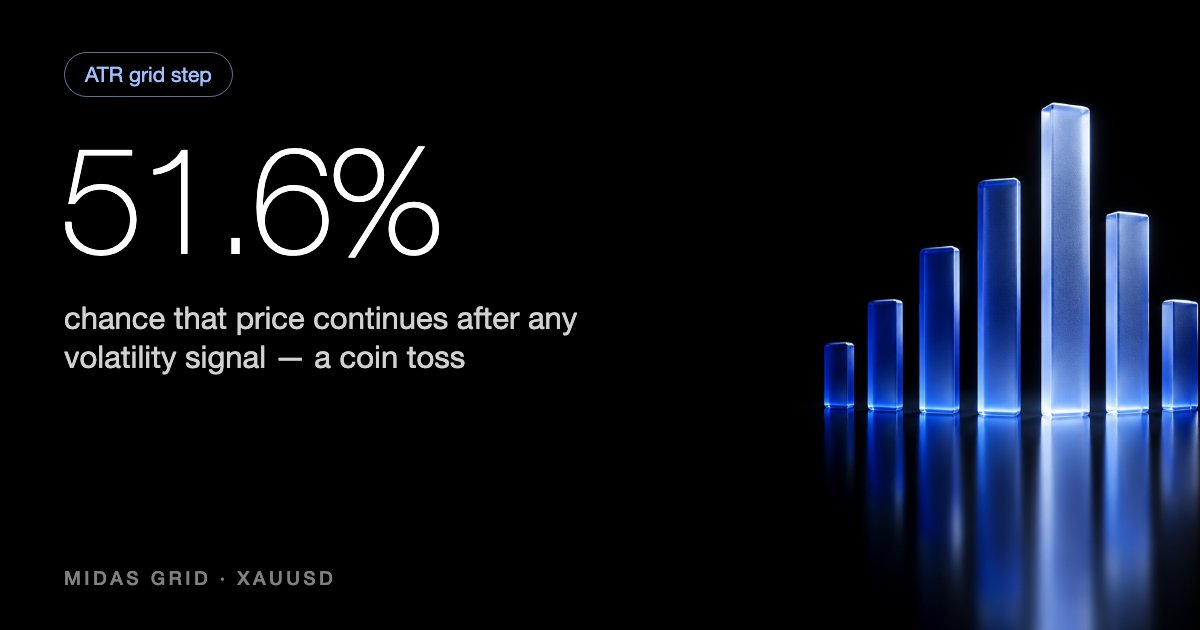
Result: the chance that price continued $3 before pulling back was about 51.6% for every one of them. On seconds and minutes there was a small statistical effect, but after the spread none of 70 combinations made money. High volatility tells you the next move is likely to be big. It does not tell you whether it will be with your basket or against it.
What a wider step does to the arithmetic
Same settings, only the step changes (cent account, $1,000, first lot 0.01, ×2, 11 orders, 1:2000, stop-out 40%, no spread):
| Step | Last (11th) order below the first | Stop-out below the first order | Pullback from the last order to break-even | Deposit to survive $100 | Deposit to survive $150 |
|---|---|---|---|---|---|
| $1.50 | $15.00 | $61.53 | $1.49 | $1,788 | $2,811 |
| $1.95 | $19.50 | $65.58 | $1.94 | $1,705 | $2,728 |
| $3.00 | $30.00 | $75.03 | $2.98 | $1,511 | $2,535 |
| $4.00 | $40.00 | $84.04 | $3.98 | $1,327 | $2,350 |
| $6.00 | $60.00 | $102.05 | $5.97 | $958 | $1,982 |
Three things to read from it:
- Tripling the step does not triple the room. From $1.95 to $6.00 the ladder gets three times longer, but the stop-out moves only from $65.58 to $102.05. Once all 11 orders are open, the room left is set by the deposit and the total lots (20.47), not by the step: about $42–47 in every row.
- A wider step needs a bigger pullback. From the last order to break-even the basket needs $1.94 at step $1.95 and $5.97 at step $6.00.
- A wider step fills fewer orders in an ordinary move. After a $30 move against the first order, step $1.95 has all 11 orders open, a floating loss of $254.64 and needs $12.44 back to break even; step $4.00 has 8 orders open, −$14.98, and needs $5.87; step $6.00 has 6 orders, −$3.42, and needs $5.43.
Where an ATR step fails
- It lags. ATR averages the last N candles. In the hour 15:00–16:00 UTC on 29 January 2026 gold fell $314.21; a basket built in the calm before that hour had narrow steps and was full before ATR could widen.
- It narrows in the calm. In quiet hours ATR shrinks the step and the grid fills on a small move. A break out of a quiet range is when a dense grid hurts most.
- It changes income as well as risk. Wider steps mean fewer baskets a day and a bigger pullback to close each one, so income falls along with the risk.
- It does not choose a side. As the 51.6% above shows, volatility can be used to trade less or wider, never to pick the direction of the basket.
What worked better in our model
- More deposit per 0.01 lot and fewer orders. These change the room in the table directly; see 7 protections for a martingale bot.
- A step that widens on the far orders by a fixed rule (for example $1.95 up to the 5th order, then ×1.5 per order, cap 10). In our model over 22 months at $1,050 per 0.01 it cut account blow-ups from 6 to 3 with about the same gross income, but the result was sensitive to small changes of the setting, so treat it as a lead to test, not a recipe.
- Pausing new baskets around big releases, justified by the size of the move, not by its direction (gold on NFP, CPI and FOMC days).
How to check a step for your settings
- In the grid calculator change only the step and note the stop-out distance and the deposit for the move you want to survive.
- Look at how far gold moves in an hour and a day: gold hour profile, gold daily range.
- Run two steps side by side in the Midas Grid emulator over the whole history since January 2025 and replay the worst days (stress test guide).
- What each grid setting does: step, multiplier and order count.
FAQ
Is an ATR grid step better than a fixed step?
Not by itself. It widens the ladder after volatility has risen, which helps in a slow trend, but it lags sudden jumps and narrows the grid in calm hours. With the same deposit and number of orders, the room left once all orders are open is about the same for any step.
Can volatility predict the direction of gold?
Not in our tests. The size of the next move was partly predictable (r ≈ 0.52 between the last hour's volatility and the next 15 minutes), but for every trend, impulse and breakout signal we tested the chance of continuation was about 51.6%.
Which ATR period and timeframe should I use?
There is no setting we can recommend from the data. Whatever you choose, check the narrowest step it can produce in the grid calculator: that is the grid you will have when a quiet market suddenly breaks.
Does a wider step make a grid safer?
It moves the stop-out further away, but less than the step grows: from $1.95 to $6.00 the stop-out on $1,000 moves from $65.58 to $102.05. It also needs a bigger pullback to close each basket and gives fewer baskets.
What decides the stop-out, if not the step?
The deposit and the total lots of the full basket. Once all orders are open, every $1 against the basket costs as many dollars as it has lots on a cent account (20.47 for 11 orders from 0.01), whatever the step was.